
It's All About Home
Your Go-To Place for Residential Property Information
Your Go-To Place for Residential Property Information
Buying a home is a very stressful process. Whether you are a real estate investor or you want to buy a home to live in, you have to make a thorough analysis of the real estate market to make a smart decision.
As an investor you may be interested in the amount of rent you would get for the investment you want to make. As a first time home buyer, you may be interested in finding where you can afford to buy. If you want to live in the home, you may want to only look for homes in a particular region in a particular metro. If you only want to rent out the place, you may want to look at the entire real estate market. As you see, the way you want to analyze the market depends on your specific use case. There are many tools like zillow, trulia and redfin which let you search for homes based on many criteria once you have a good idea of where and what you want to buy. But, there are not many tools to help you if you with the basic analysis of real estate market - current state of the market, where you can afford to buy a home, trends over the past few years, best places to invest, etc.
We built this tool to address these problems. The visualizations in this tool help you get a broad picture of the US real estate market. You can find patterns in the market over the past few years and over many geographical locations. You can also drill down into specific metros/regions to get more specific information about the locations you are interested in.

Where in the US can you afford a home? Where you can get best living condition?

Where in the US is the real estate market active? Where is attracting the most attention?
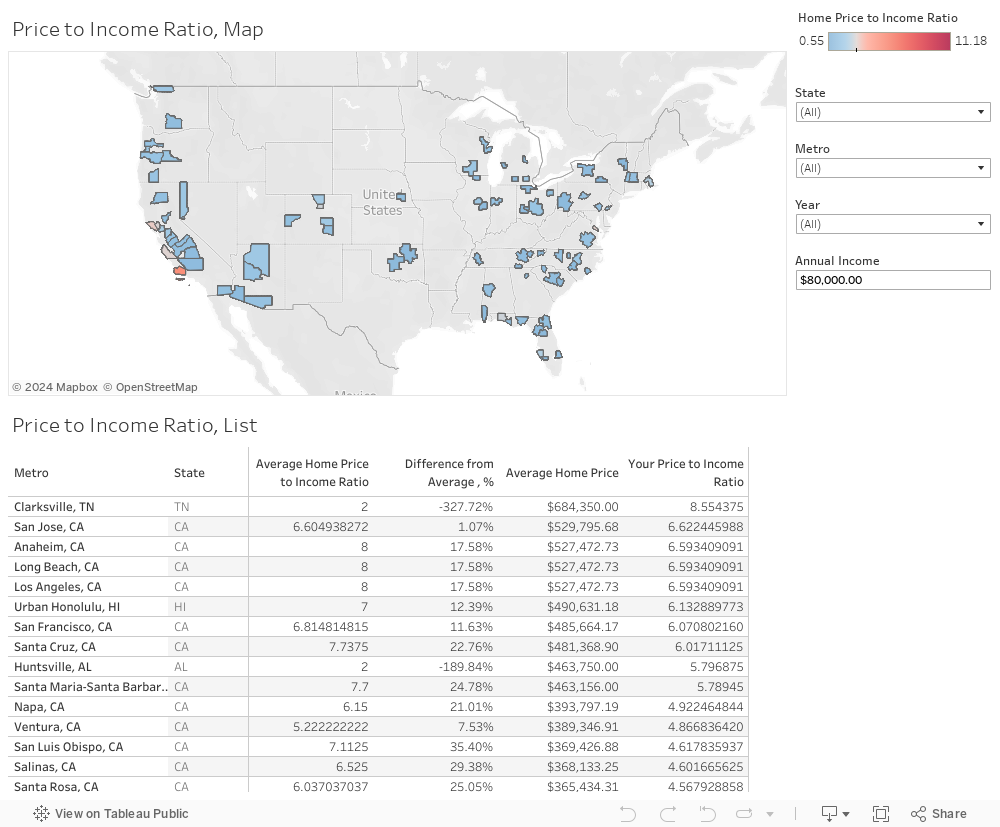
Buying a house is always an exciting yet terrifying time. In a volatile market like real state, It is difficult to gauge where current home value stand in relation to their historic numbers and where you stand with respect to the housing market. The Price-to-Income ratio can be a useful metric when gauging these and can help to compare affordability of housing across different cities in US. The ratio is the median price of a house to the median level of household income in a given area. Historically this number is around 2.7 in United States. The lower this ratio the more affordable that region is, as a rule of thumb CNN money (http://money.cnn.com/pf/money-essentials-home-buying/) believes to aim for a home that costs about two-and-a-half times your gross annual salary. If you have significant credit card debt or other financial obligations like alimony or even an expensive hobby, then you may need to set your sights lower.
The graph below shows the price to income ratio across US. Enter annual gross income and explore home price to income ratio for different regions for any year of your interest. The list also shows how you stand with respect to the average in that region.
Price-to-Income Ratio: We first calculate the median housing price based on zillow data and then calculate the monthly mortgage payment assuming 20% downpayment. Resulting number is divided with median income derived from census data.
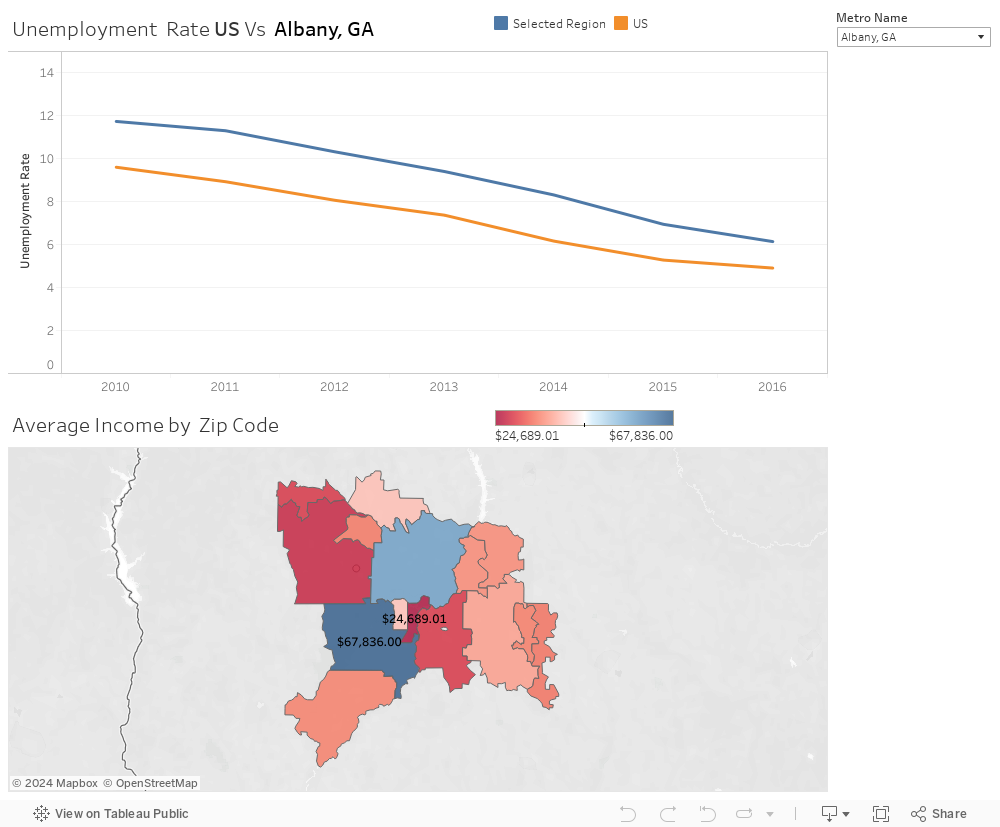
We understand that affordability is not the only criteria one looks at while buying a home . One expects to keep his job around the same area where he is buying the house, to build assets with home purchase. Also affordability in an area does not guarantee affordability in a particular zip code.
The first visual would help users to understand the economic conditions in an area. One can compare the unemployment rate wth that of the rest of the country and also analyze the trend. Also users can analyze the average income by zip code in that area.
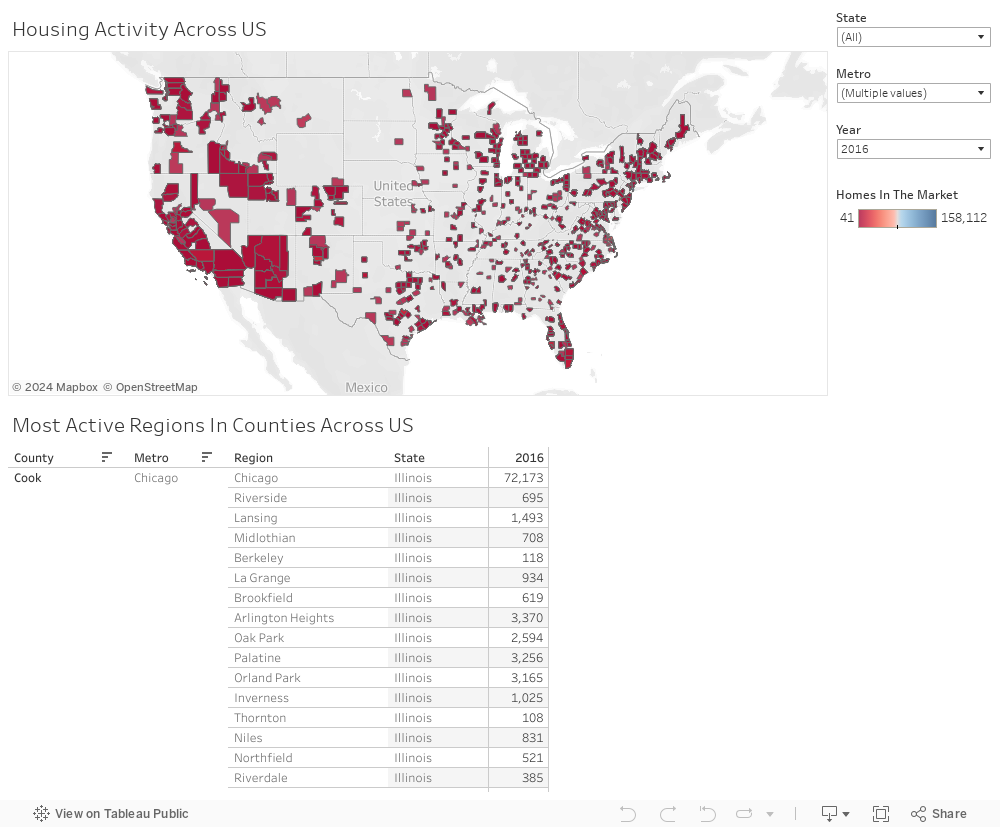
The activity in the real estate market is a good indicator of the health of the market. Analyzing the inventory (the number of homes in the market) can help you make an informed decision in not only investing in a housing market but also in finding a home you want to live in. The inventory changes every year and can be tracked in 2 different ways - based on time and region. Tracking the inventory in a region can help you find out the most active markets in a county, metro or state. Tracking the inventory year over year helps can help you find out patterns of variations in different locations and thus figure out if the pattern can be beneficial for you to buy a home. For example, in the city of Chicago, the inventory dropped by 50% between 2010 and 2013, whereas during the same period of time, the inventory in New York remained about the same. The visualization below also provides a list view with the most active regions in the US listed in a descending order. The list gets updated based on the filters chosen.
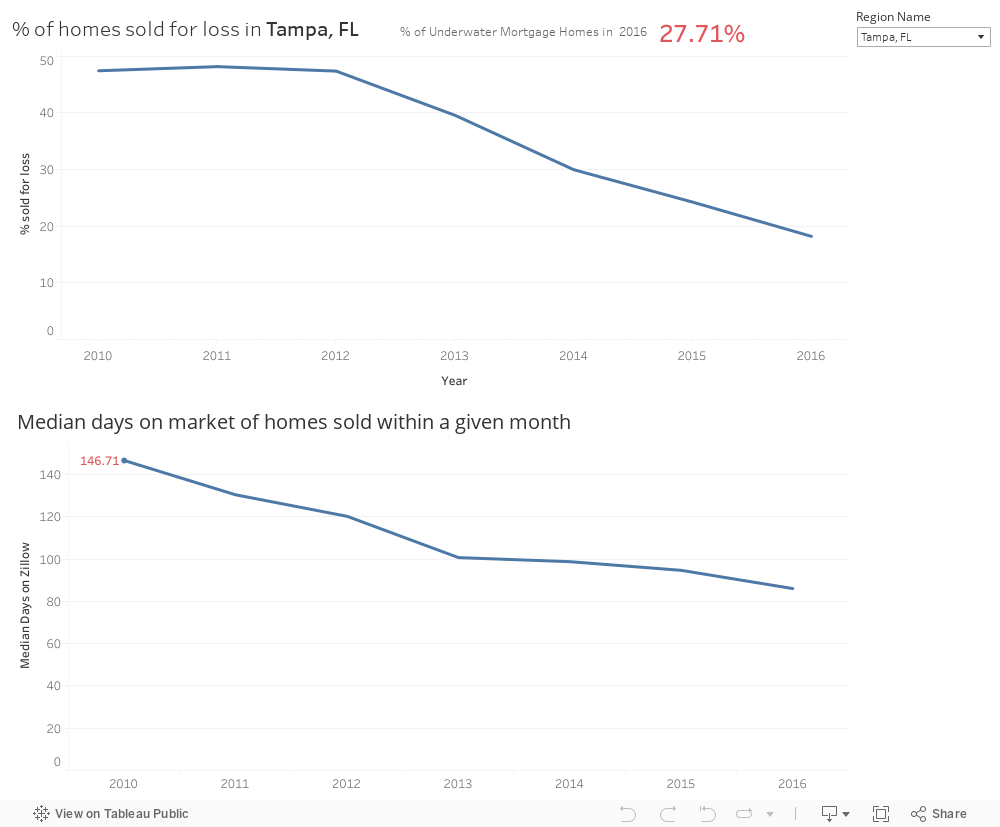
The visualizations below help in understanding the overall housing market in a selected region. One can analyze the trend of % of homes sold for loss, trend of median days on market of homes sold within given month and also the % of homes with underwater mortgage.
If region has upward trend for homes sold for loss and also upward trend for median days on market of homes sold then it an indicator for bad housing market.
When it comes to property investment, it is always so hard to narrow down the focus to a few specific region.
This section could help you evaluate, from a cash flow standing point, which zip code can give you the highest return on investment.
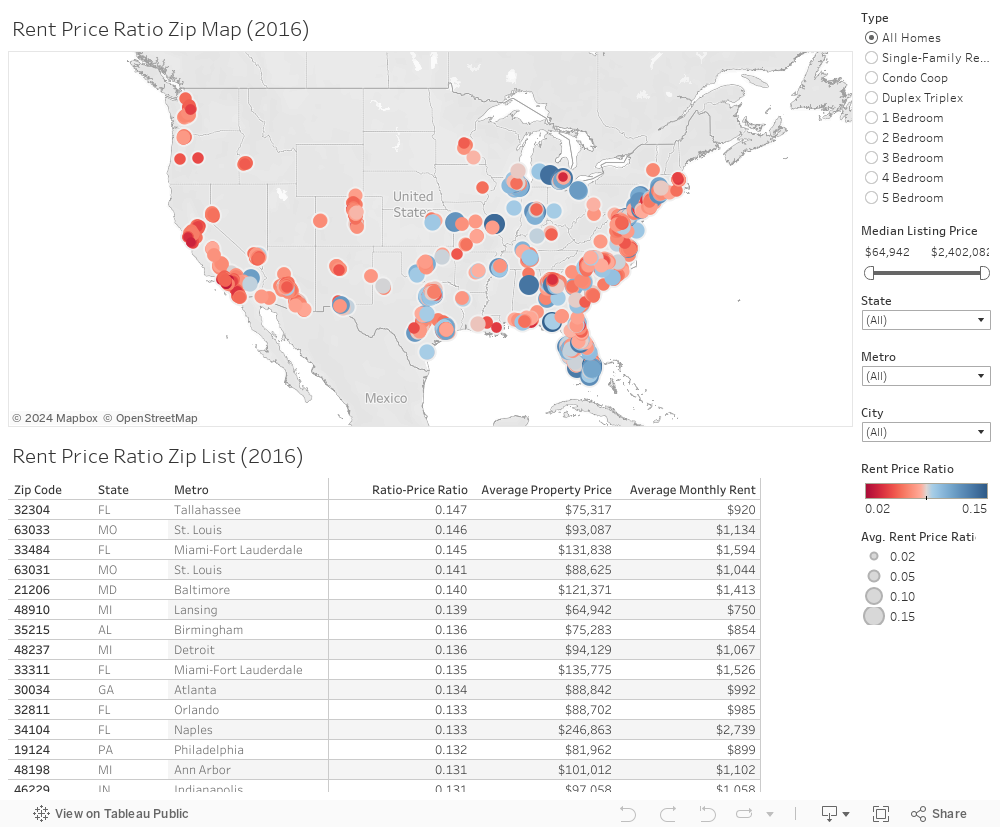
Below is a detailed look-up tool for rent price ratio by zip-code. Please use the filter on the right-hand side to select the property type, median price, and geographical region that you are interested in. Please hover over the dots to view detailed information regarding particular zip code. The zip code list below the map is sorted by RP (Rent-Price) Ratio to help your search. Once you change the filter value, the data on both the list and the map are updated.
Rent-Price Ratio: annual rent divided by property price - a higher value indicates a higher amount of cash flow.
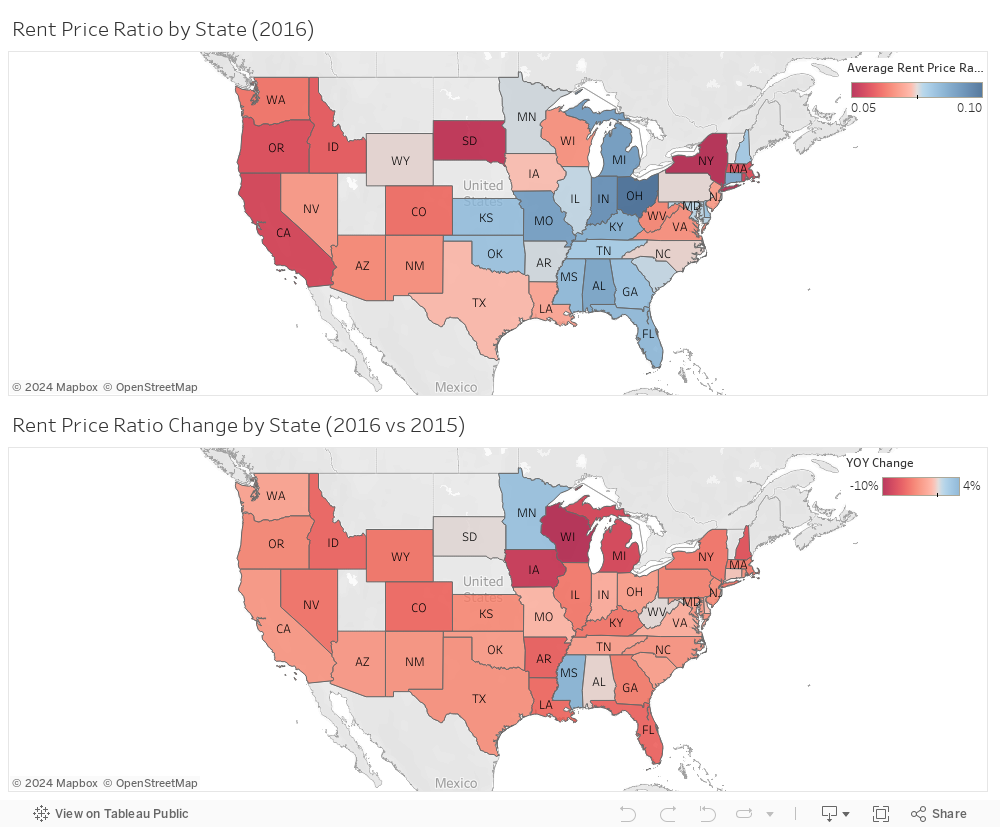
Two static charts below gives a high-level overview of state level rent price ratio and the YOY ratio change. The top chart shows which state, on average, has a higher rent price ratio; the bottom chart shows the ratio change from 2015 to 2016.
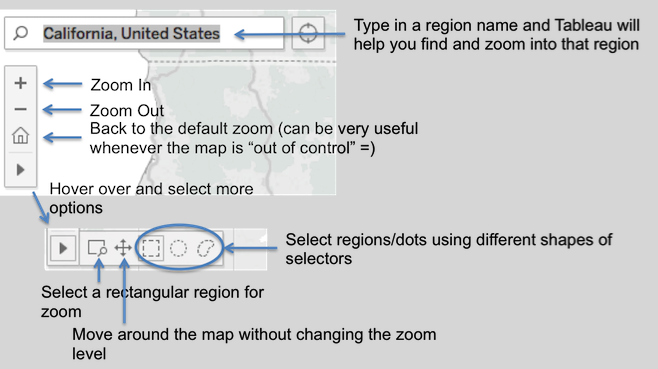
If you are not familiar with Tableau Maps, here are some tips to help you get started!
If you have any questions or suggestions about this website, please feel free to contact our team!
Nilesh Bhoyar: nilesh.bhoyar@ischool.berkeley.edu
RaghuRam Pamidimarri: rpamidimarri@ischool.berkeley.edu
Rui Chen: chenrui@berkeley.edu
Talieh Hajzargarbashi: talieh@berkeley.edu